EMI3News & insightProduct
Integrating Visual Data with other sources
One of the biggest issues with asset management is the number of databases and systems required to keep on top of the health of your fleet.
Each different system means there’s a separate log-on required or a simple spreadsheet report needing to be updated periodically by the Reliability Engineer.
Of course, such a disjointed approach leads to wasted time and unnecessary effort.
However, with technology improving, there are now tools available to offer solutions for these inefficiencies.
For example, both ZoneMaintenance and RouteMaintenance allow you to electronically collect visual data. This means there’s an accurate record of what the inspector can see, smell, hear and touch.
Why is this so important?
Well, previously, this information could only be recorded on paper service sheets or in a notepad that lives in the fitter’s pocket.
Here at EMI, we’ve integrated our software with other databases to present this critical information on the same single screen.
We can show defects captured via ZoneMaintenance and RouteMaintenance and Oil Samples. Plus, we can compare the mean time between failures (MTBF) results with the number of defects collected to see how production is impacted - particularly when the MTBF is down, or defects are not being rectified.
As the access to more data sources increases, we’ll be able to present far more on-screen information.
Plus, there’ll be options to send out alerts via email or mobiles when trigger points are reached, as well as view all the information on a smartphone.
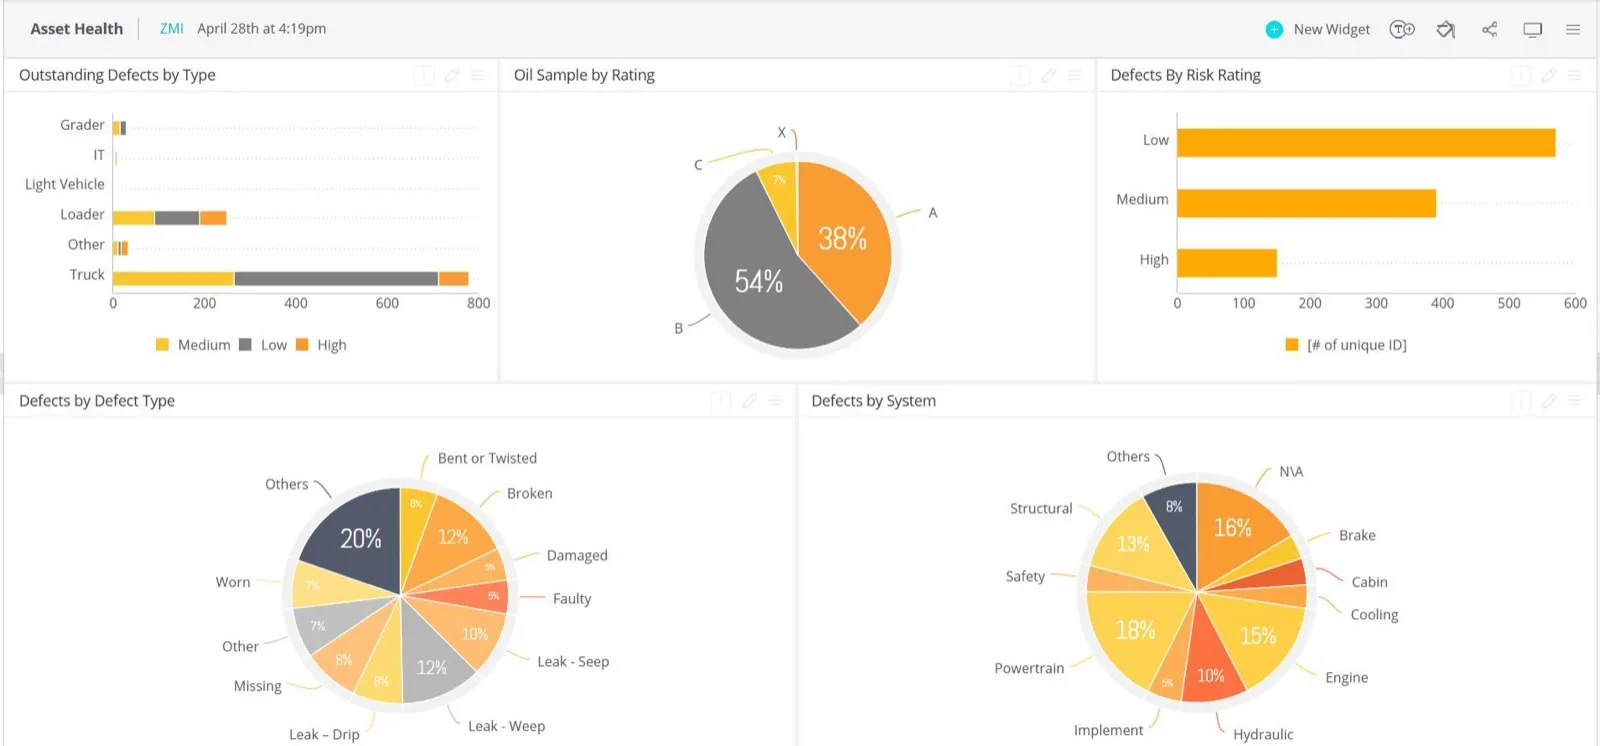
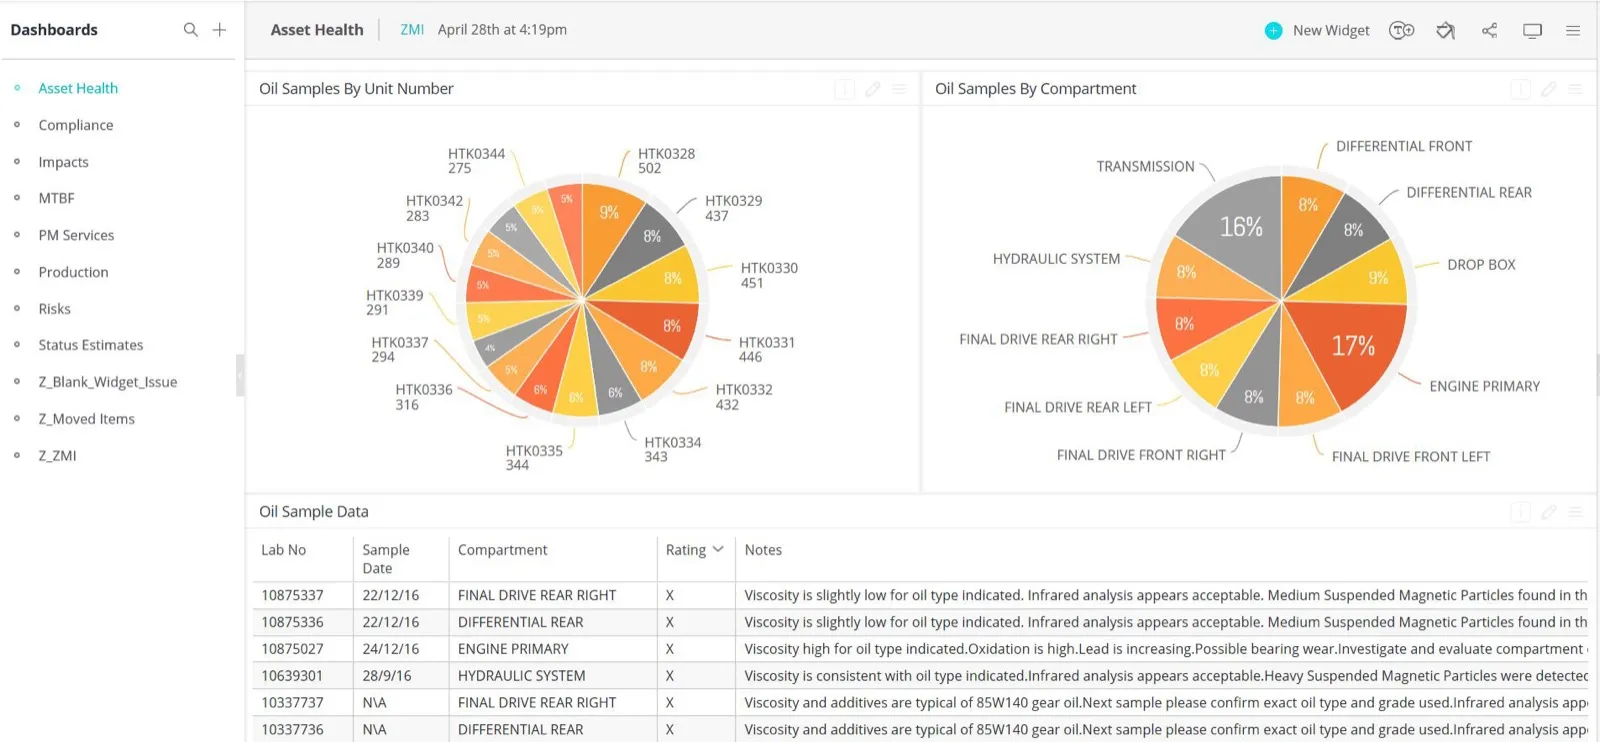
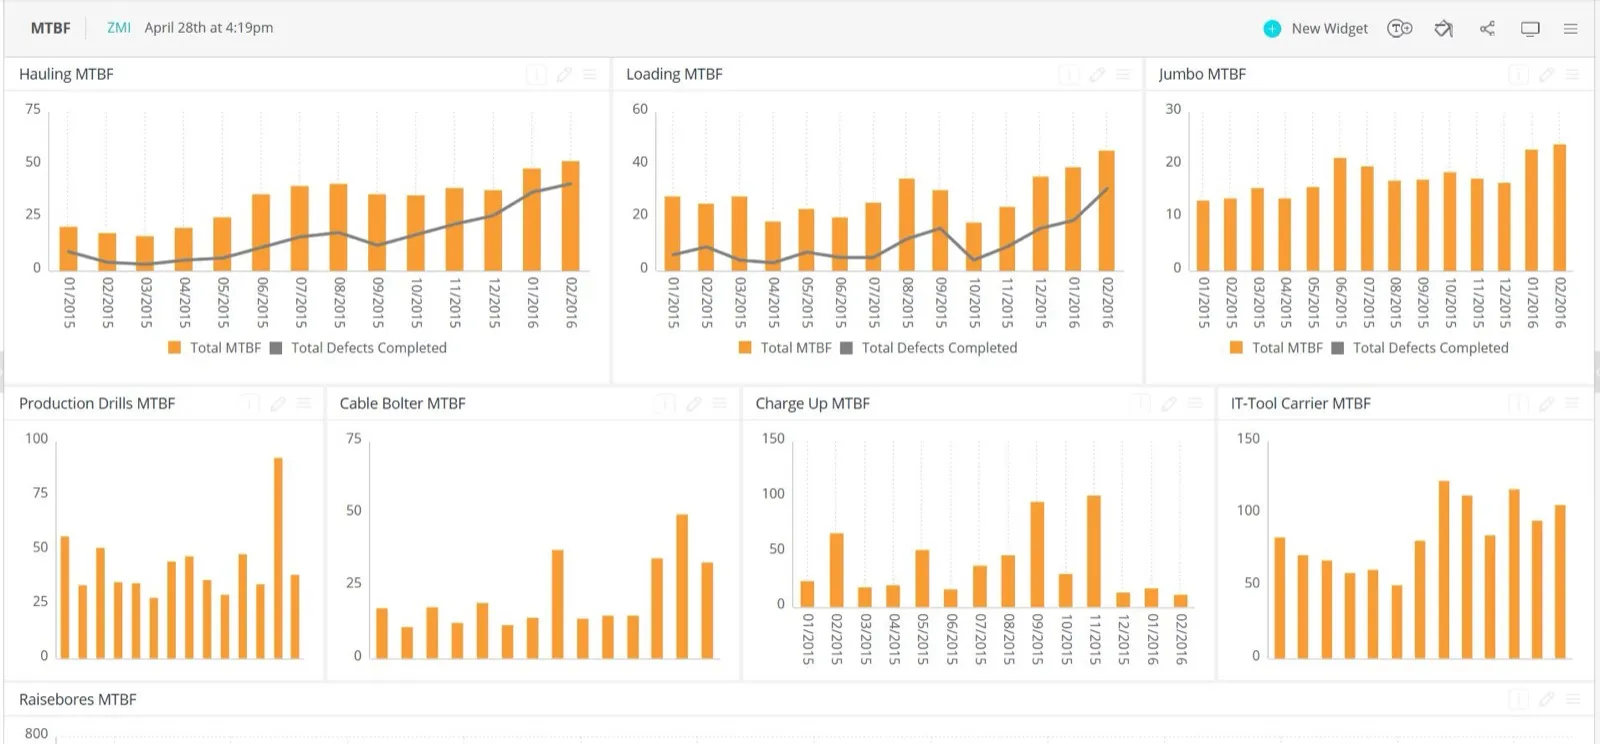
Imagine the benefits of seeing which components are nearing change out and view their up-to-date health data. You can access vital information such as known outstanding defects, oil sample results, fuel burn, MTBF history, and machine onboard event summaries all on one dashboard.
One thing is for sure: decisions will be made with more clarity and for the right reasons because the data will be more readily available.
It’s still early days, but already a lot has been achieved in a very short time. And the full vision is now definitely possible.
Below are some screenshots of a web tool (dashboard) that we’ve developed to integrate the visual defect data with oil sample data.
We’ll also be able to include the following:
- Work orders
- Fuel burn
- Onboard events and condition monitoring values
- Life cycle status
In addition to these powerful integrations, our tools also allow remote access to information via mobile devices to assess the condition of each asset and how they’re being managed.
If this sounds like the opportunity you’ve been waiting for, then get in touch for more information.
Was this useful?
We read every response. It decides what we write next.
We will not add you to a mailing list.
Keep reading
Product
Inside the limits, and still going wrong
A condition monitoring question captures a number and a photograph. The platform trends it across the fleet, watches the rate of change, and raises an alert while the reading is still comfortably inside its limits.
4 September 2026 · 7 min read
Insight
Your CMMS is not the execution layer
Enterprise systems hold the asset record. Planning systems schedule the work. Neither of them sees the work being performed, and that gap is not a reporting problem to be fixed with another dashboard.
12 August 2026 · 8 min read
Insight
Chaos, constrained: why maintenance behaves like a complex system
Small deviations at the start of a shift produce very large differences by the end of it. You cannot remove that sensitivity, but you can bound it, the way aviation and surgical systems do.
29 July 2026 · 6 min read