Sensory Based Data
the missing link
Mining maintenance teams face immense pressure to maximize equipment uptime, minimize breakdowns, and ensure efficient production. While advancements in data collection and analysis have revolutionized maintenance practices, there remains a critical, often overlooked component: integrating sensor-based data with the sensory observations of field personnel.
The Evolution of Maintenance Practices
Decades ago, mining maintenance was reactive—fixing equipment only after it broke. The shift to preventative maintenance (PM) introduced planned inspections and formalized processes. Sites began leveraging oil sampling, vibration analysis, and sensor technologies to monitor asset health. This evolution brought measurable improvements in productivity and reduced downtime.
However, despite these advancements, maintenance teams still struggle with gaps in defect reporting and incomplete understanding of asset conditions.
The Persistent Problem
Even in the digital age, many sites rely on outdated, manual processes:
Paper-based service sheets and defect notes often get lost in filing cabinets or go unrecorded in the CMMS (Computerized Maintenance Management System).
Missed defect reporting occurs when field technicians lack time or tools to record observations during shifts.
The result? Critical issues go unnoticed until catastrophic failures occur.
ZoneMaintenance Analysis
Bridging the Gap: The Missing Link
What’s missing is a system that integrates sensory based data — what technicians see, hear, smell, and touch — with the sensor-based data collected automatically.
Why Sensory-Based Data Matters
Field technicians possess an innate ability to detect early signs of failure that sensors alone might miss:
Unusual noises indicating bearing wear.
Subtle vibrations pointing to misalignment.
Odors signaling overheating or contamination.
This sensory input provides a nuanced understanding of asset health, complementing the data from onboard sensors or SCADA systems.
The Solution: Digital Tools for Real-Time Integration
Modern technology enables teams to capture both sensory and sensor-based data digitally, ensuring no observation is overlooked. Here's how it works:
In-field Data Collection: Technicians use mobile devices to record observations during inspections, guided by prompts based on FMECA (Failure Mode, Effects, and Criticality Analysis).
Integrated Defect Reporting: Observations are automatically logged into the CMMS, ensuring transparency and actionable insights.
Correlated Data Analysis: Combining sensory and sensor data provides a comprehensive view of asset health, enabling trend analysis and proactive decision-making.
iPad Mobility Based Software
The Benefits of a Unified System
By aligning sensory based data with sensor-based data, maintenance teams can:
Identify hidden defects before they escalate into major issues.
Improve decision-making with a complete asset health picture.
Reduce downtime and maintenance costs by addressing problems early.
Proven Tools for the Mining Industry
At Equipment Management International (EMI), our suite of software solutions integrates sensory-based data into everyday maintenance practices:
ZoneMaintenance for mobile equipment.
RouteMaintenance for fixed plants.
ComponentStatus for individual components.
SafetStatus for company work area safety audits and inspections
EnviroStatus for environmental assessments and inspections.
These tools are helping mining teams worldwide achieve unparalleled efficiency and reliability.
Asset Health Dashboard
Benefits of an integrated system for a complete picture
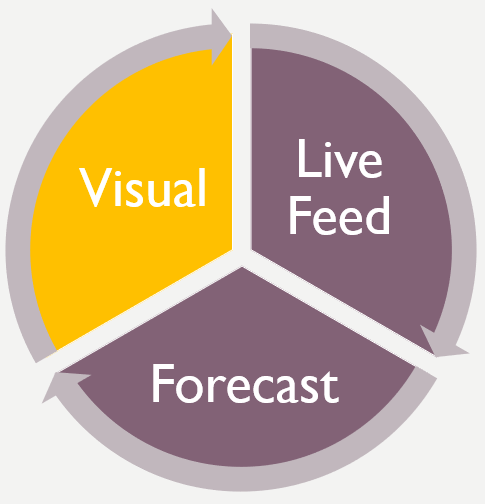
When all these pieces of information are aligned with other sources, the picture is full and clear, which means more effective decisions can be made.
Want to know you’re making the right decisions about assets every time?
The only solution is to take care of this missing link by electronically collecting and analysing both the sensor and sensory data.
While we know the missing link is this sensory-based data, there also needs to be a reliable system to correlate the in-field feedback with the other data forms.
And this system needs to prompt particular queries based on FMECA or experience, and then present this information in a format that’s easy to access and interpret.
Take the Next Step
So stay ahead in today’s competitive mining landscape, it’s essential to adopt a digitalization strategy that combines sensor and sensory data. This missing link can transform your defect reporting process, ensuring every detail is captured, analyzed, and acted upon.
Ready to elevate your maintenance game? Let’s talk about how EMI’s solutions can drive measurable improvements in your operations.
Take Action and Contact us today to learn more!


