![IMG_4188[1].JPG](https://images.squarespace-cdn.com/content/v1/57bd1b23d1758e6b2bb51a5f/1472532981835-CPZ48J79L44Z2AG6L6E0/IMG_4188%5B1%5D.JPG)
In the fast-paced world of mining, efficiency and reliability of equipment are paramount. In less than six months, one of our mining clients' mobile equipment asset management departments, within a developing country, witnessed a remarkable transformation through the application of ZoneMaintenance. This case study delves into the challenges they faced, the solutions provided by ZoneMaintenance, and the extraordinary results achieved, with a special focus on how transparency drove accountability, which in turn increased asset reliability and fundamentally changed team culture.

Understanding ZoneMaintenance
ZoneMaintenance is an innovative approach designed to streamline and enhance maintenance processes. It emphasizes dividing maintenance activities into distinct zones on the machine, each managed with clear accountability and transparency. This system not only simplifies the management of maintenance tasks but also ensures that every team member knows their role and responsibilities on the job as well as the status of each service work order from the Supervisors desk.
For a comprehensive understanding of ZoneMaintenance, visit Equipment Management's ZoneMaintenance.
Initial Challenges
Before the implementation of ZoneMaintenance, our client's mobile equipment asset management department faced several challenges:
1. Lack of Accountability: Maintenance tasks were often neglected or poorly executed due to unclear responsibilities.
2. Poor Communication: There was a significant communication gap between different teams, leading to inefficiencies and errors.
3. Inconsistent Maintenance Practices: Without standardized procedures, maintenance practices varied widely, impacting equipment reliability.
4. Low Morale and Engagement: The lack of a cohesive approach, poor action to change incorrect content and clear goals and structure resulted in low team morale and engagement towards change.
Implementing ZoneMaintenance
The introduction of ZoneMaintenance aimed to address these issues by fostering a culture of transparency and accountability. Site had also initiated improvement measures over the years and with the introduction of ZoneMaintenance, this placed them in a good position to quickly overcome their initial challenges.
The implementation process involved several key steps:
1. Defining Zones and Responsibilities
The first step was to divide the maintenance tasks into distinct roles and zones. Each zone was designed for each specific machine model and assigned a dedicated team member responsible for all activities within their areas. This clear delineation of responsibilities ensured that every team member knew their exact role and the importance of their tasks when to perform, how to and presented all the information required to doing it safely, effectively and efficiently.
2. Establishing Transparent Processes
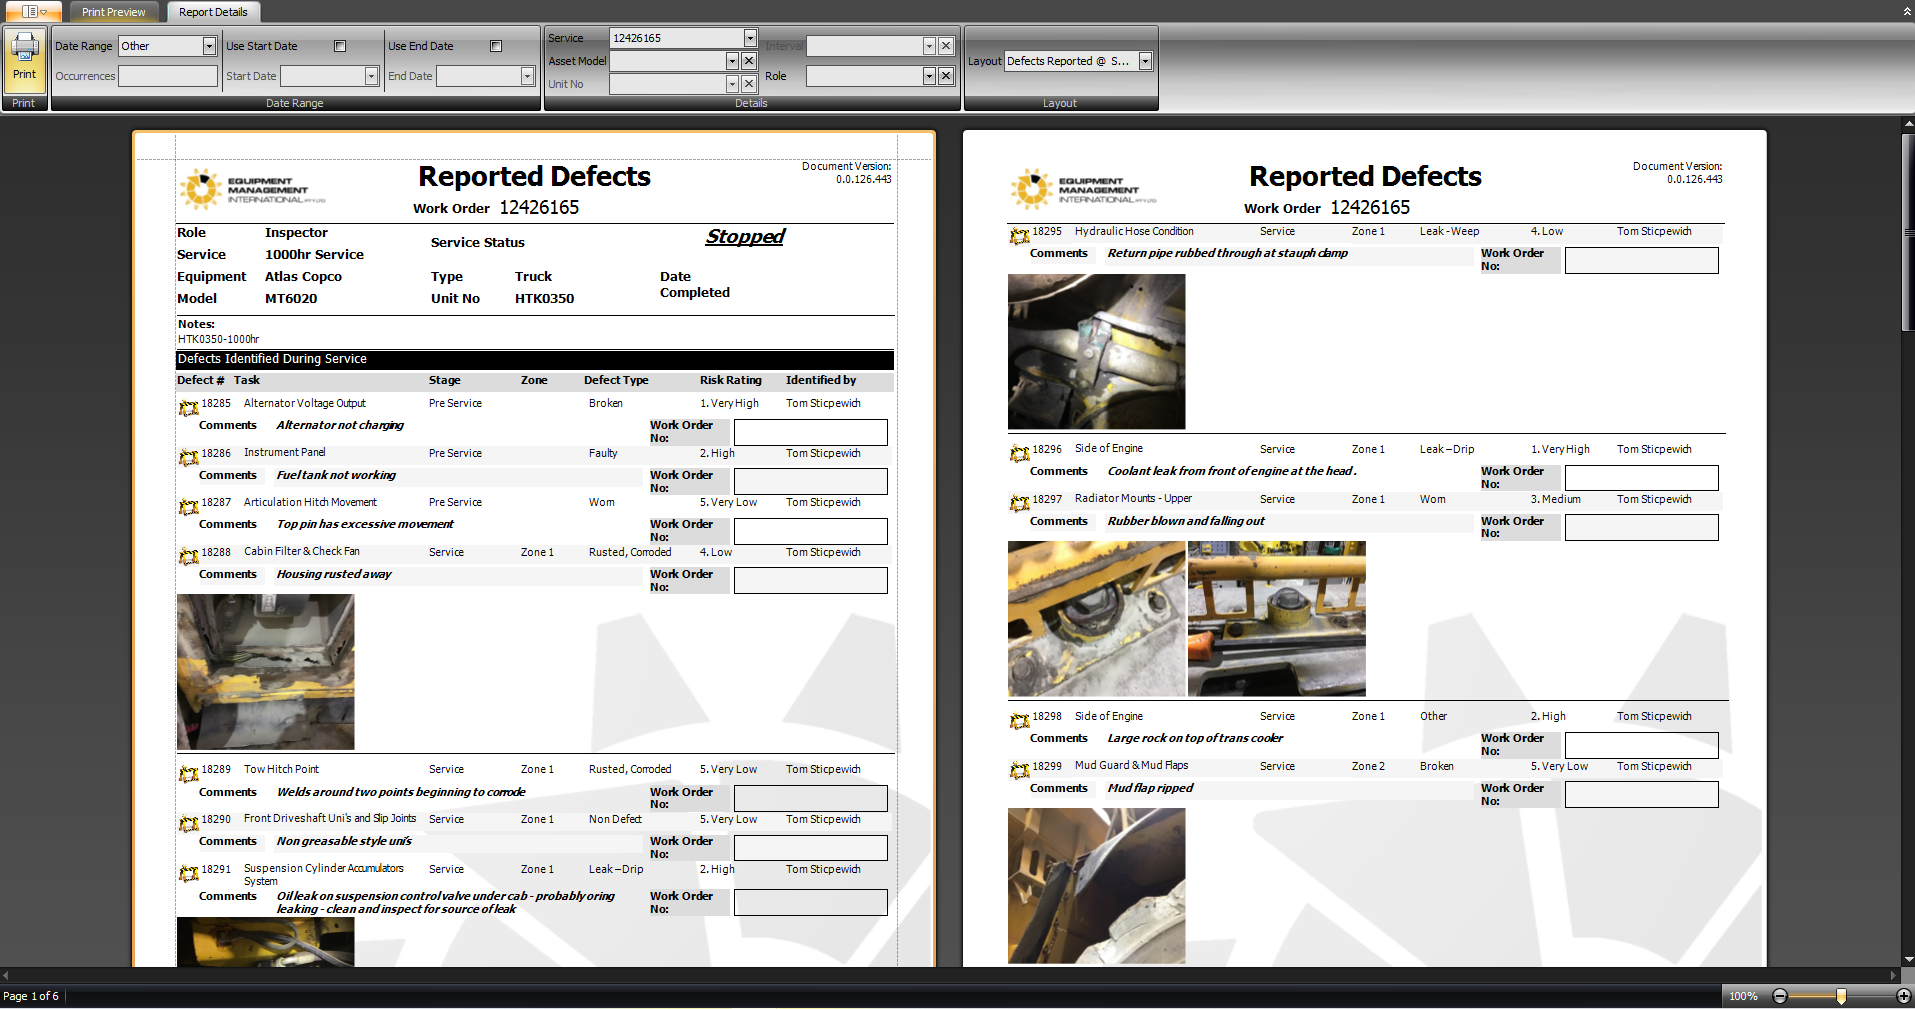
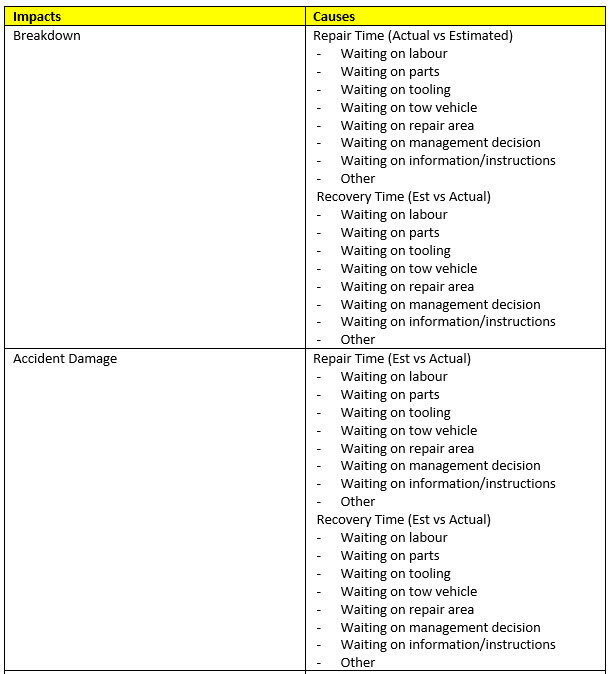
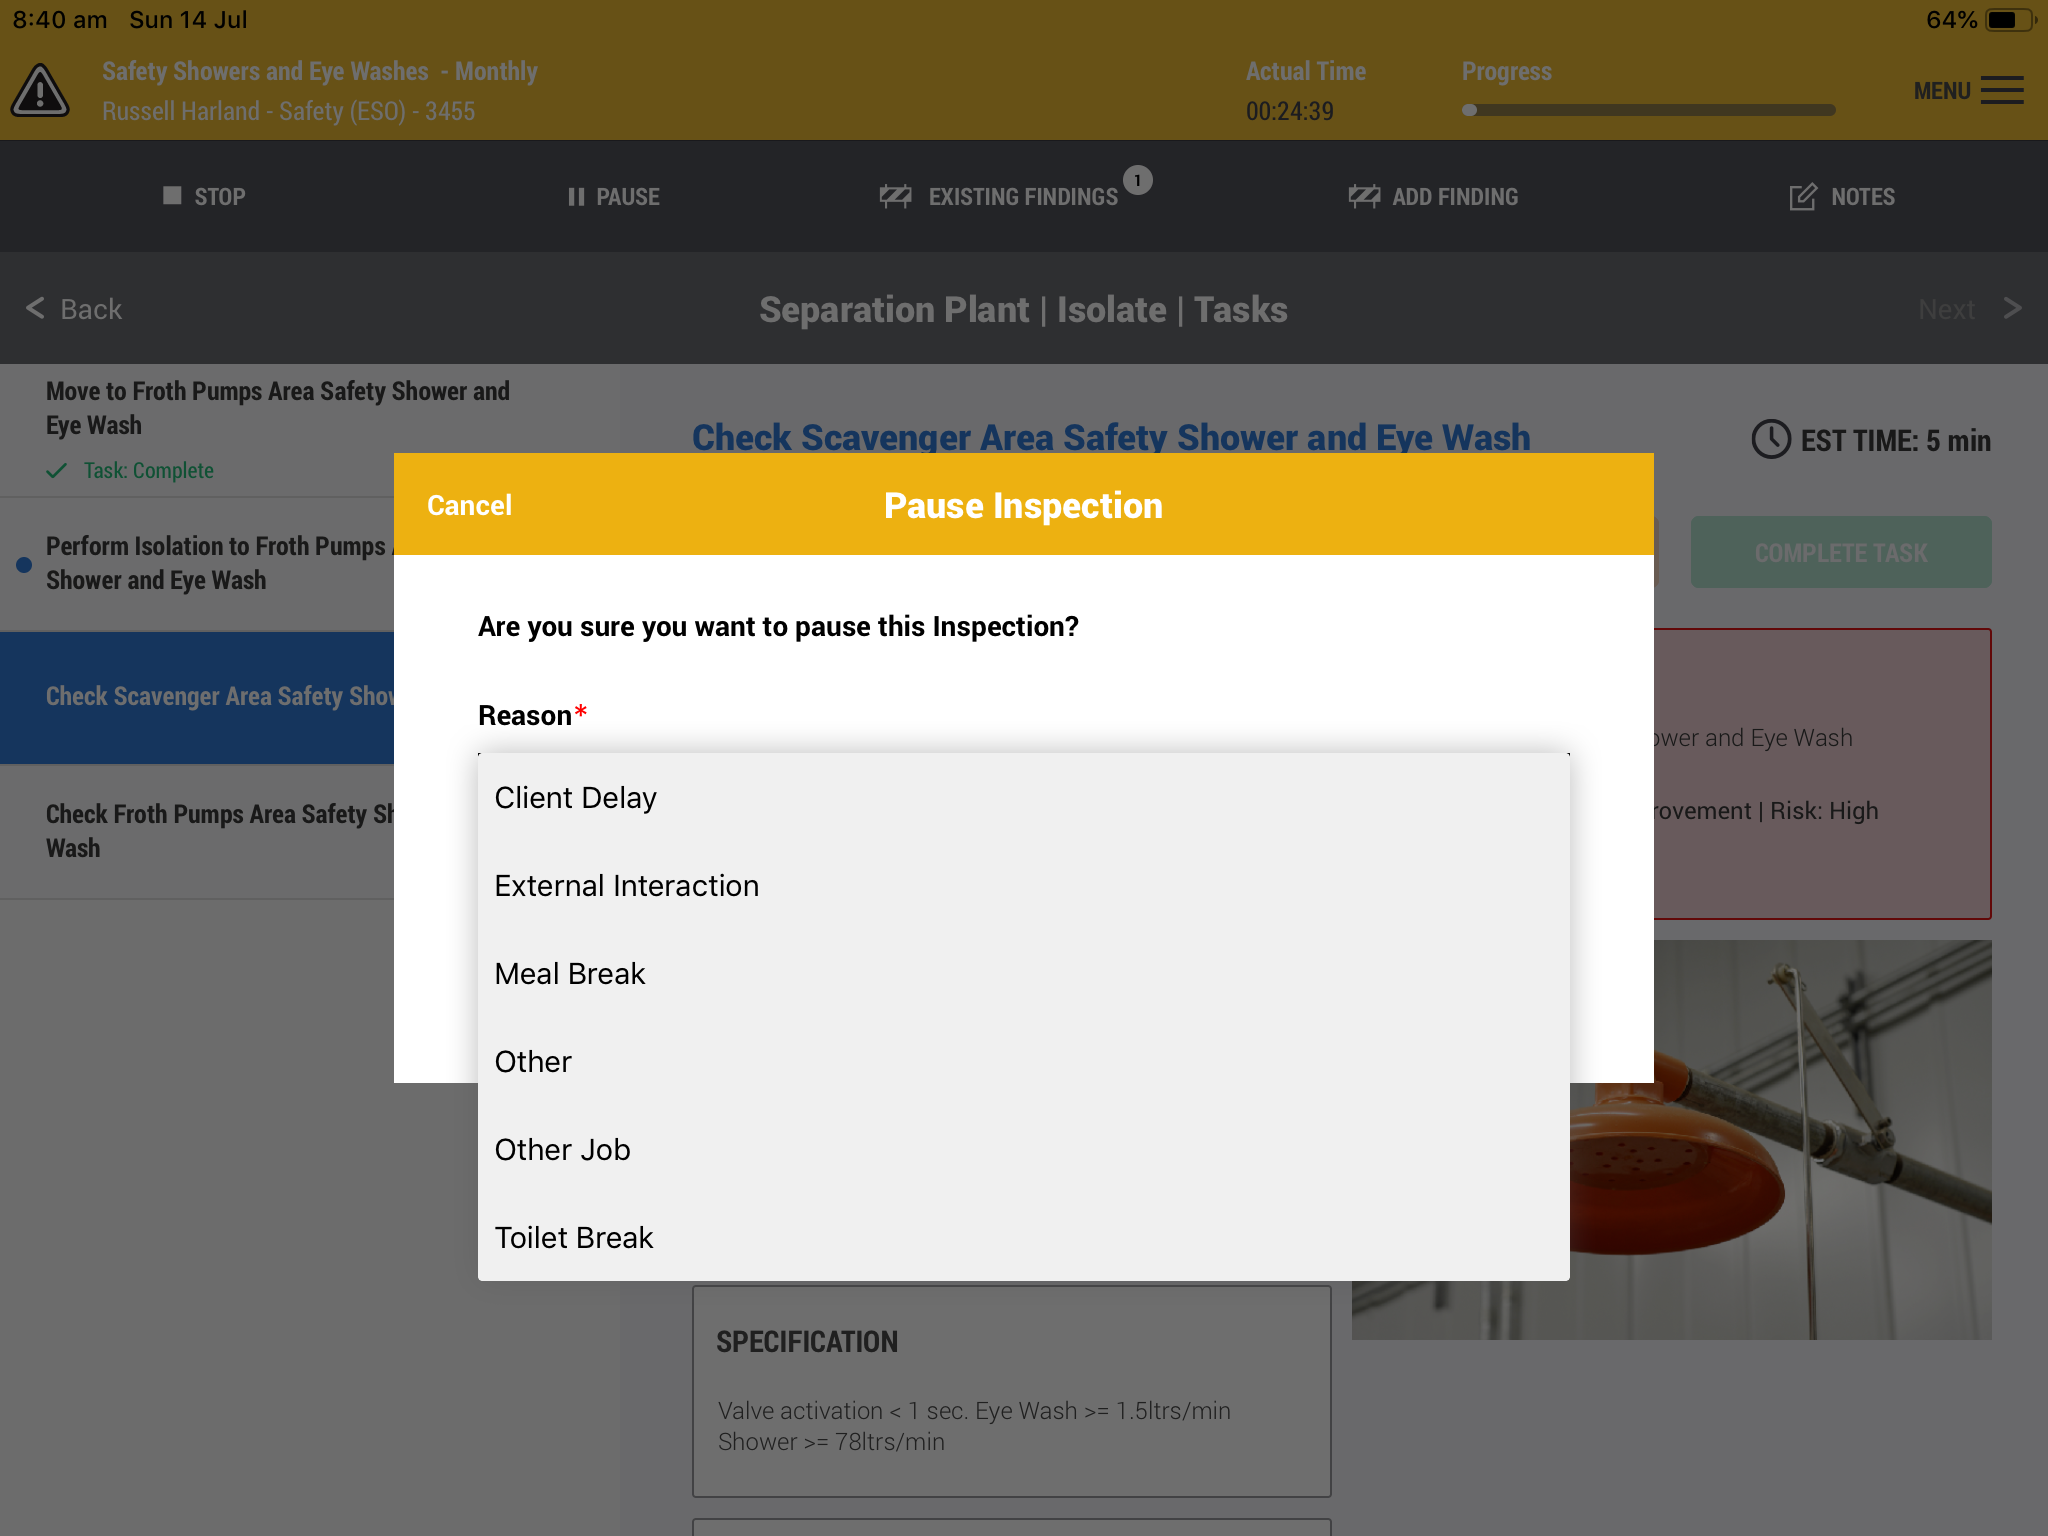
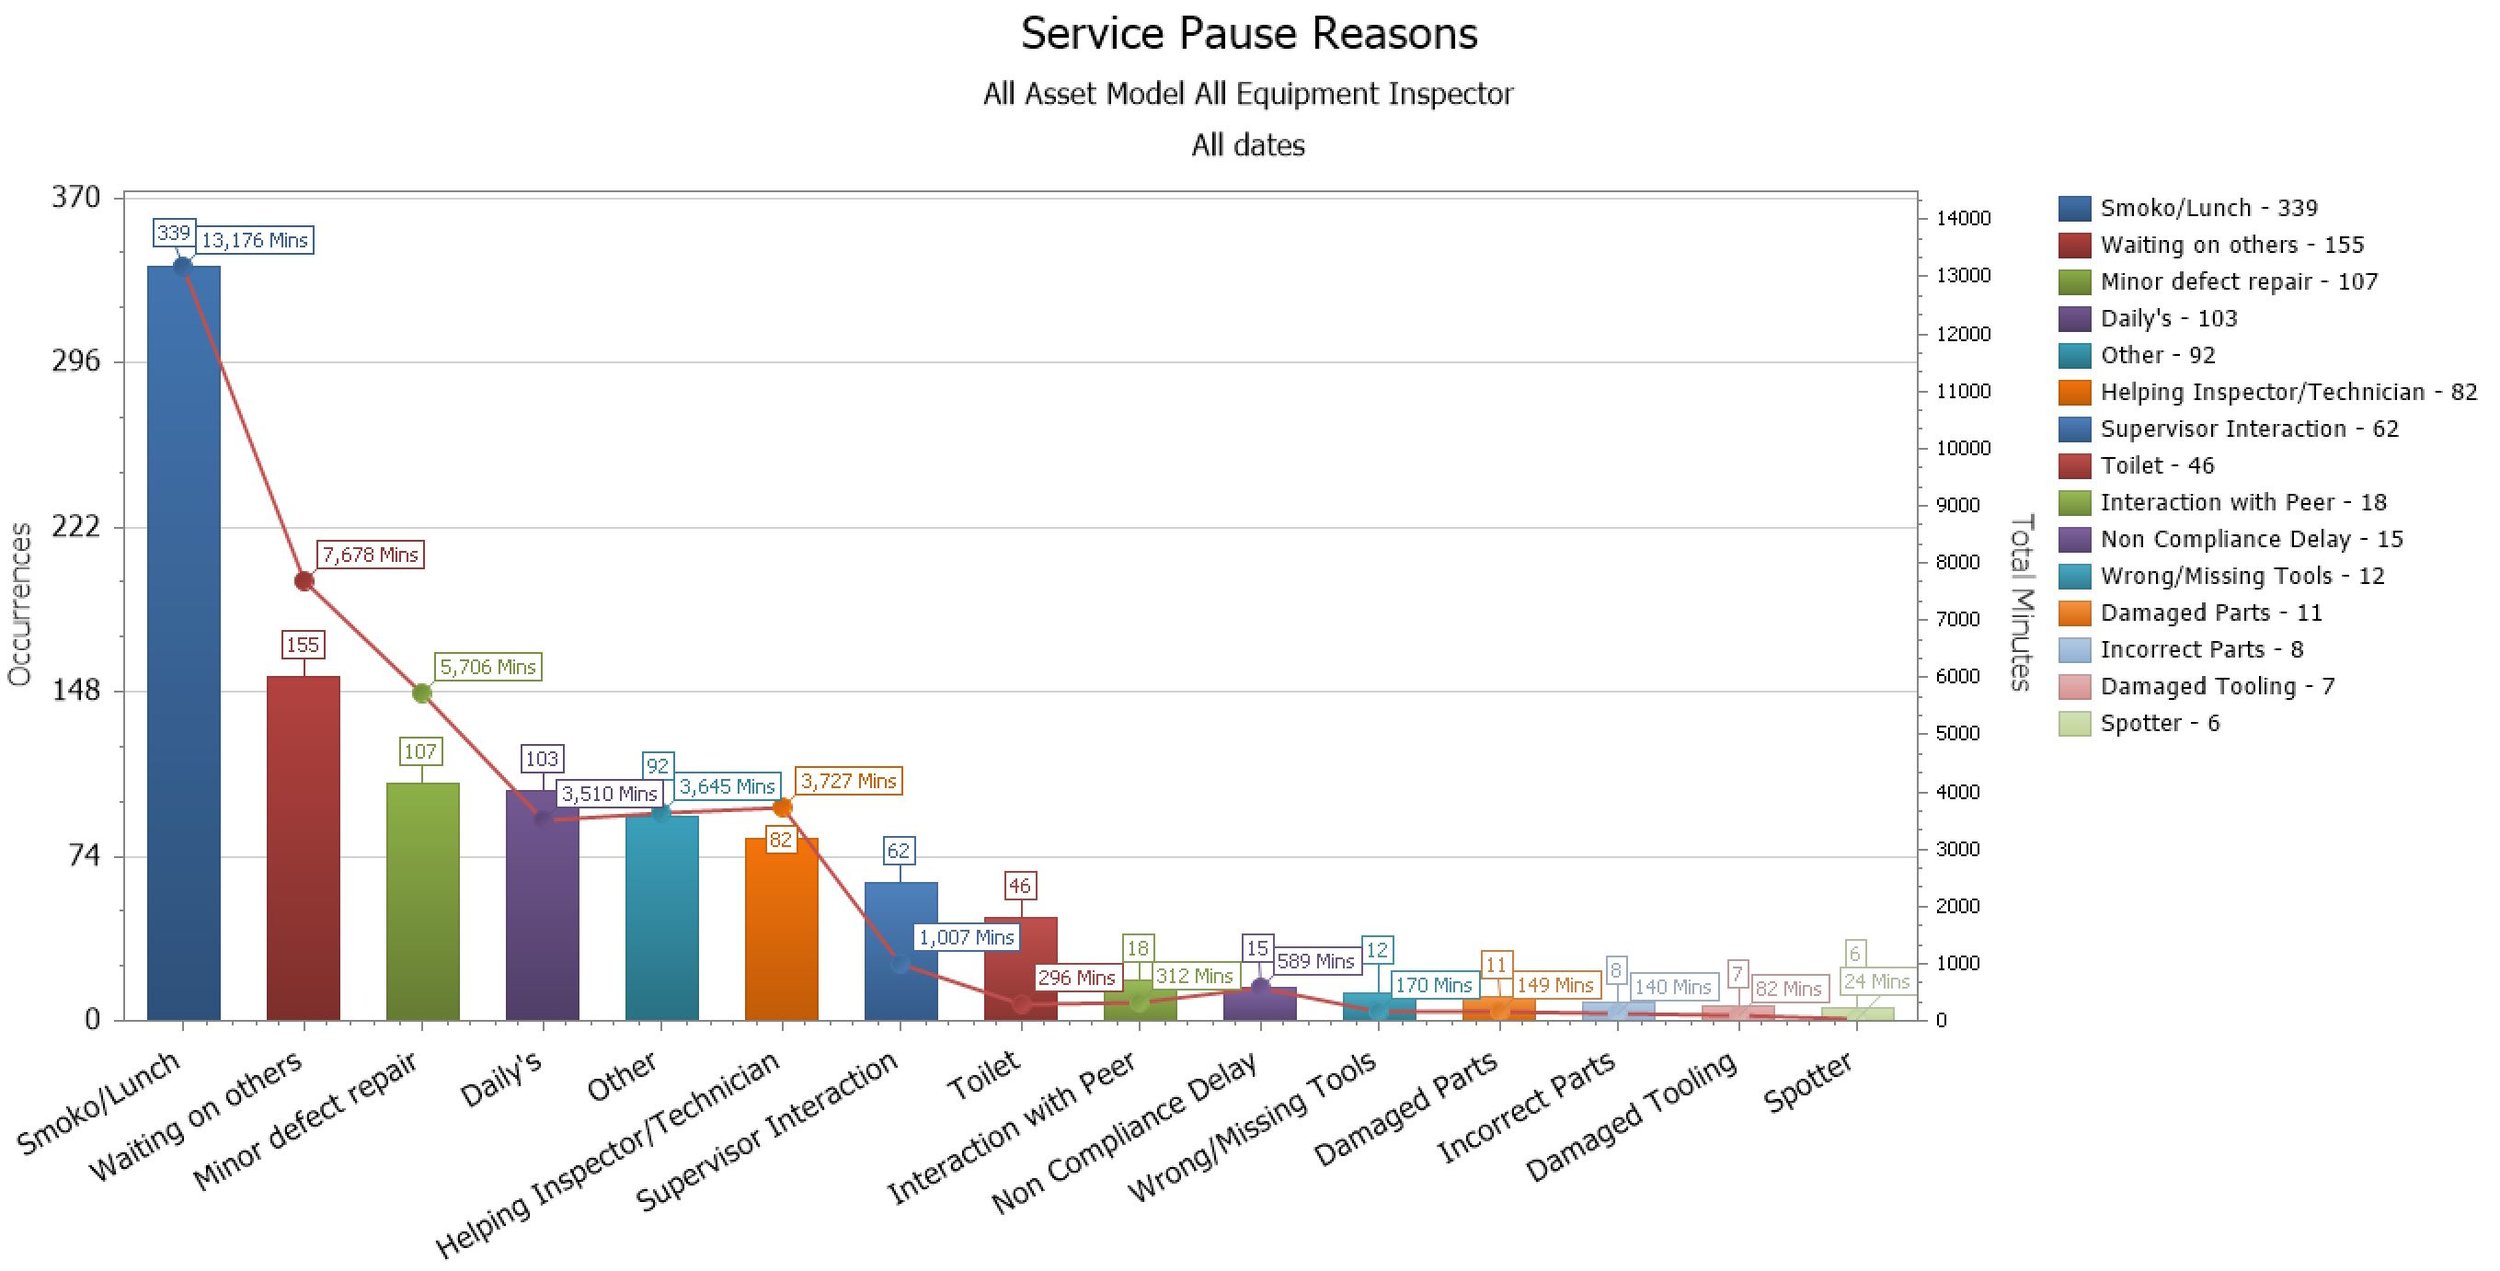
ZoneMaintenance introduced transparent processes for tracking maintenance activities. Detailed logs were maintained for each task, along with reported defects detailing the condition of the asset and service progress was monitored in near real-time. This transparency allowed for immediate identification of any delays or issues, enabling prompt corrective actions by the supervisors. Decisions made along the process is seen in the content and the registration of repair work orders to address the risk rated defects before returning the asset to work.
3. Training and Development
Comprehensive training sessions were conducted to familiarize the team with the new processes and tools. This training not only equipped them with the necessary skills but also emphasized the importance of feedback, accountability and teamwork.
4. Leveraging Technology
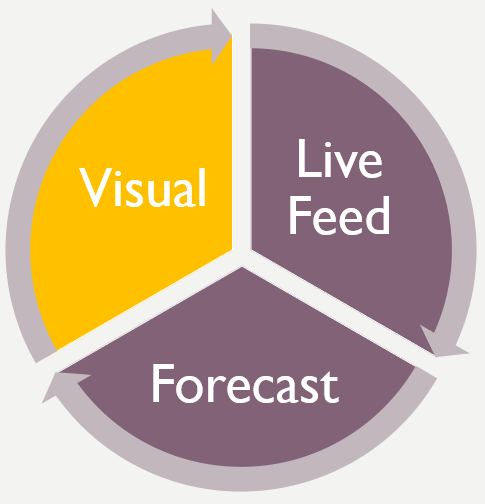
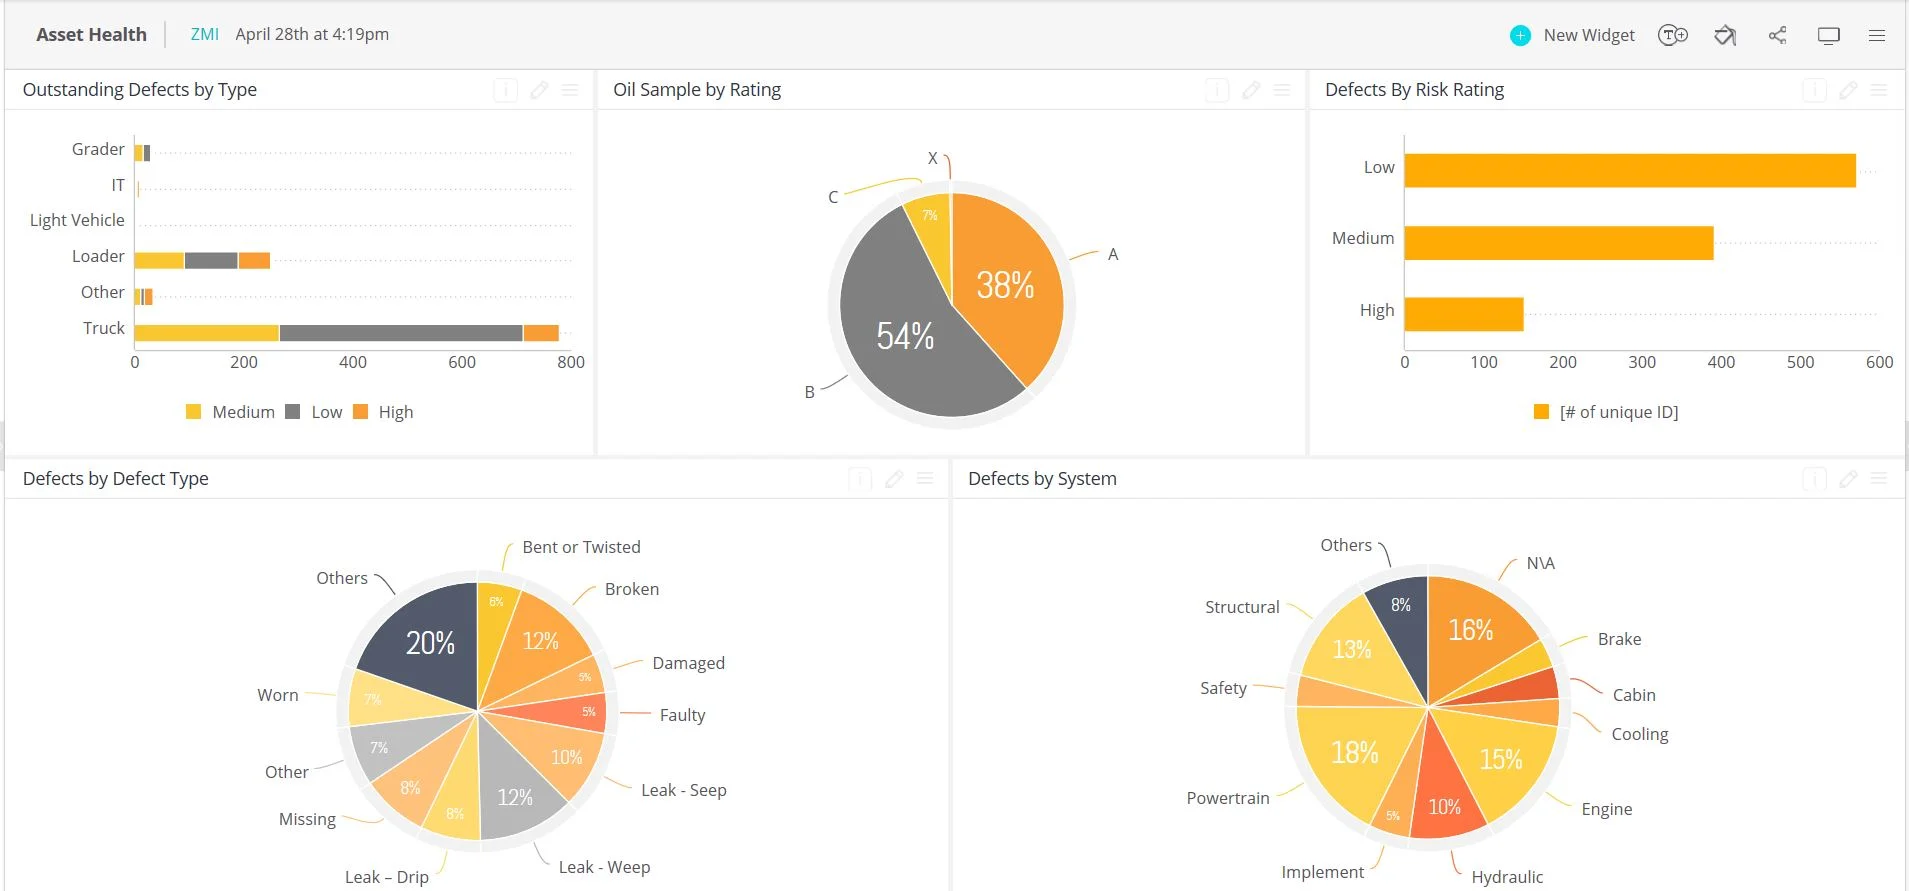
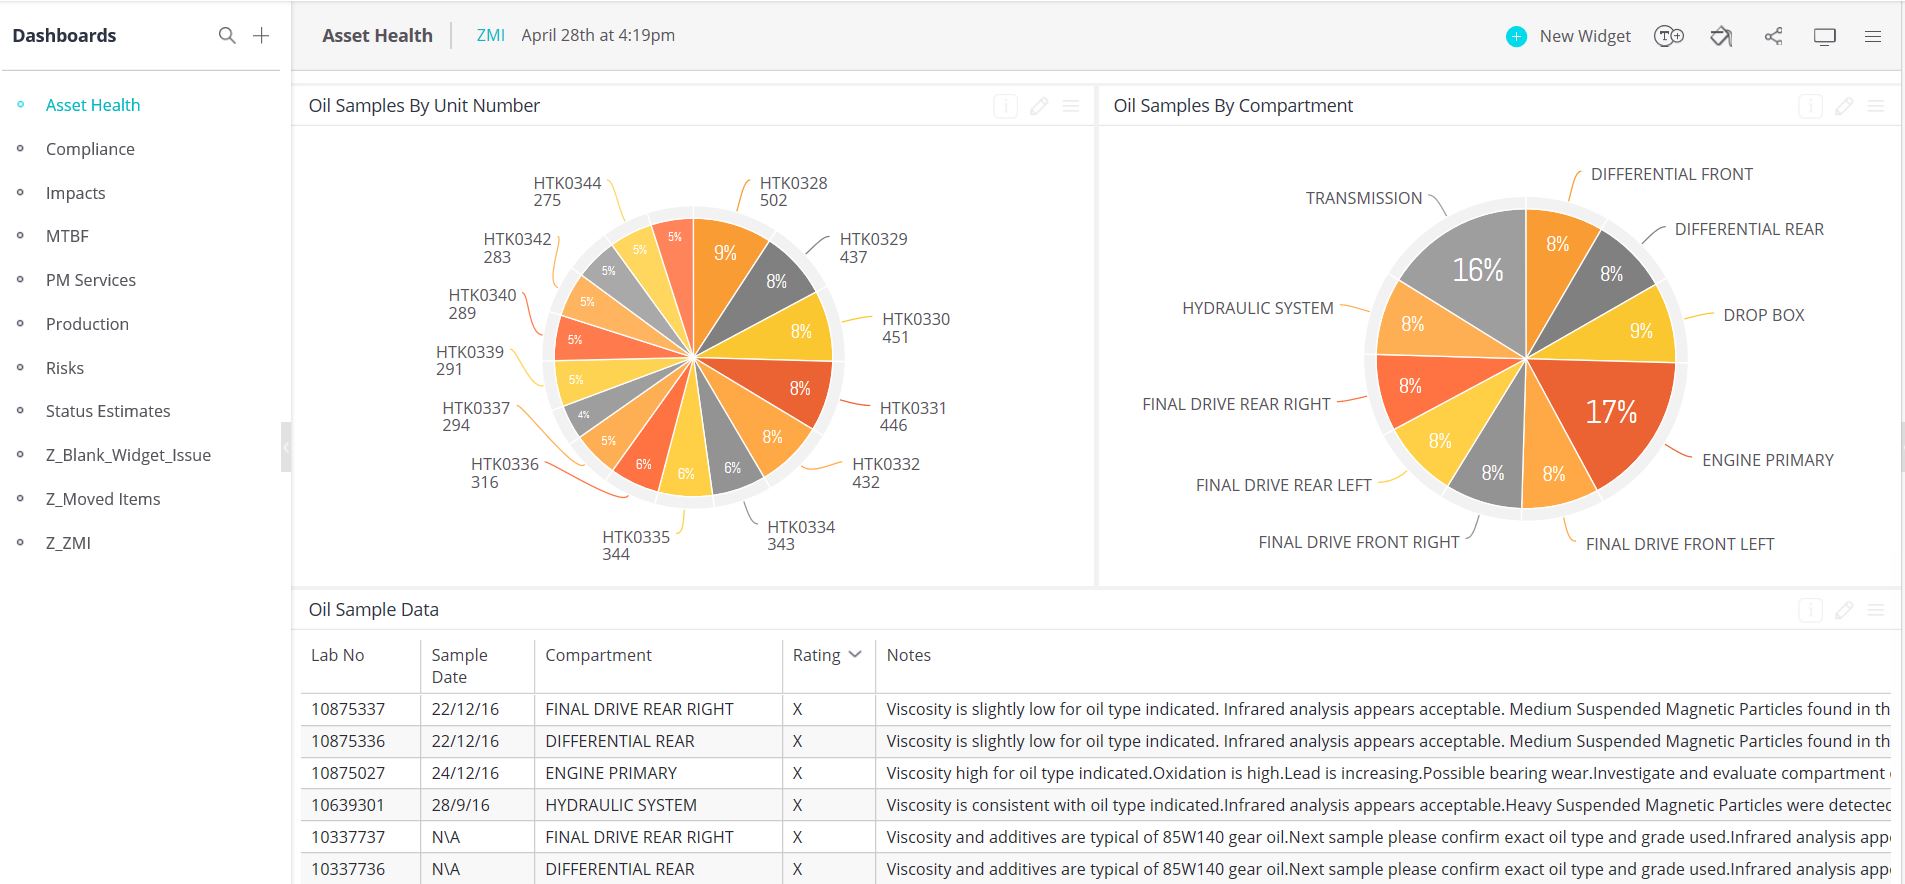
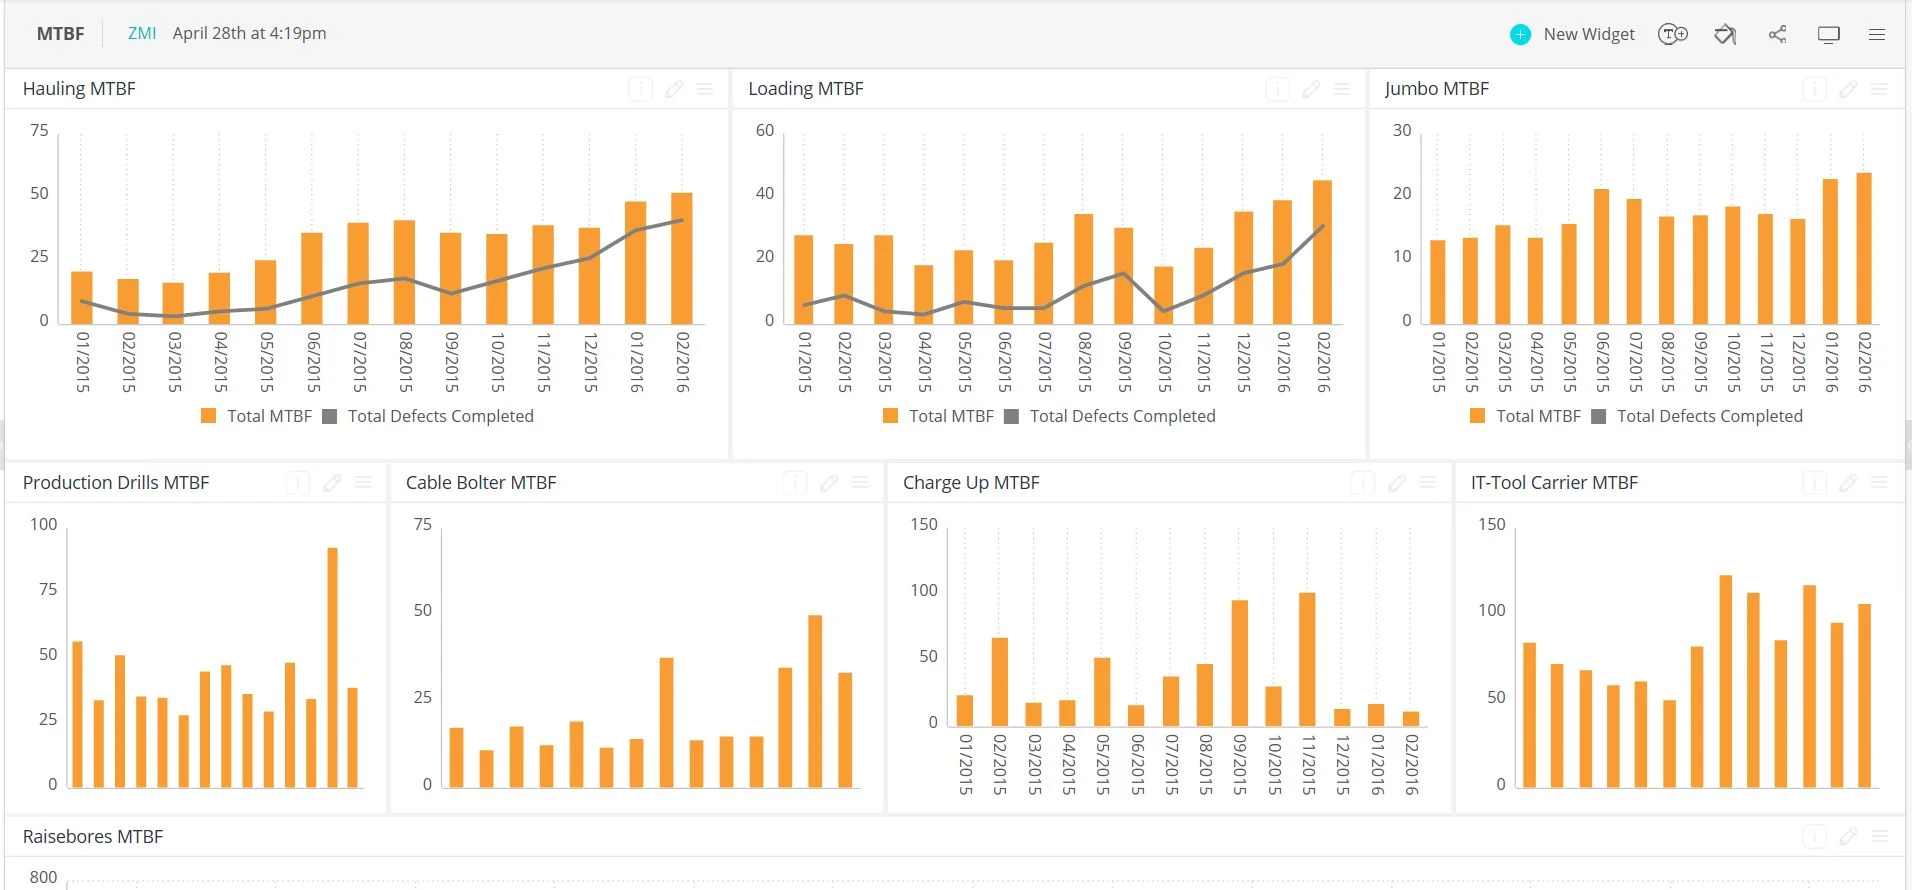
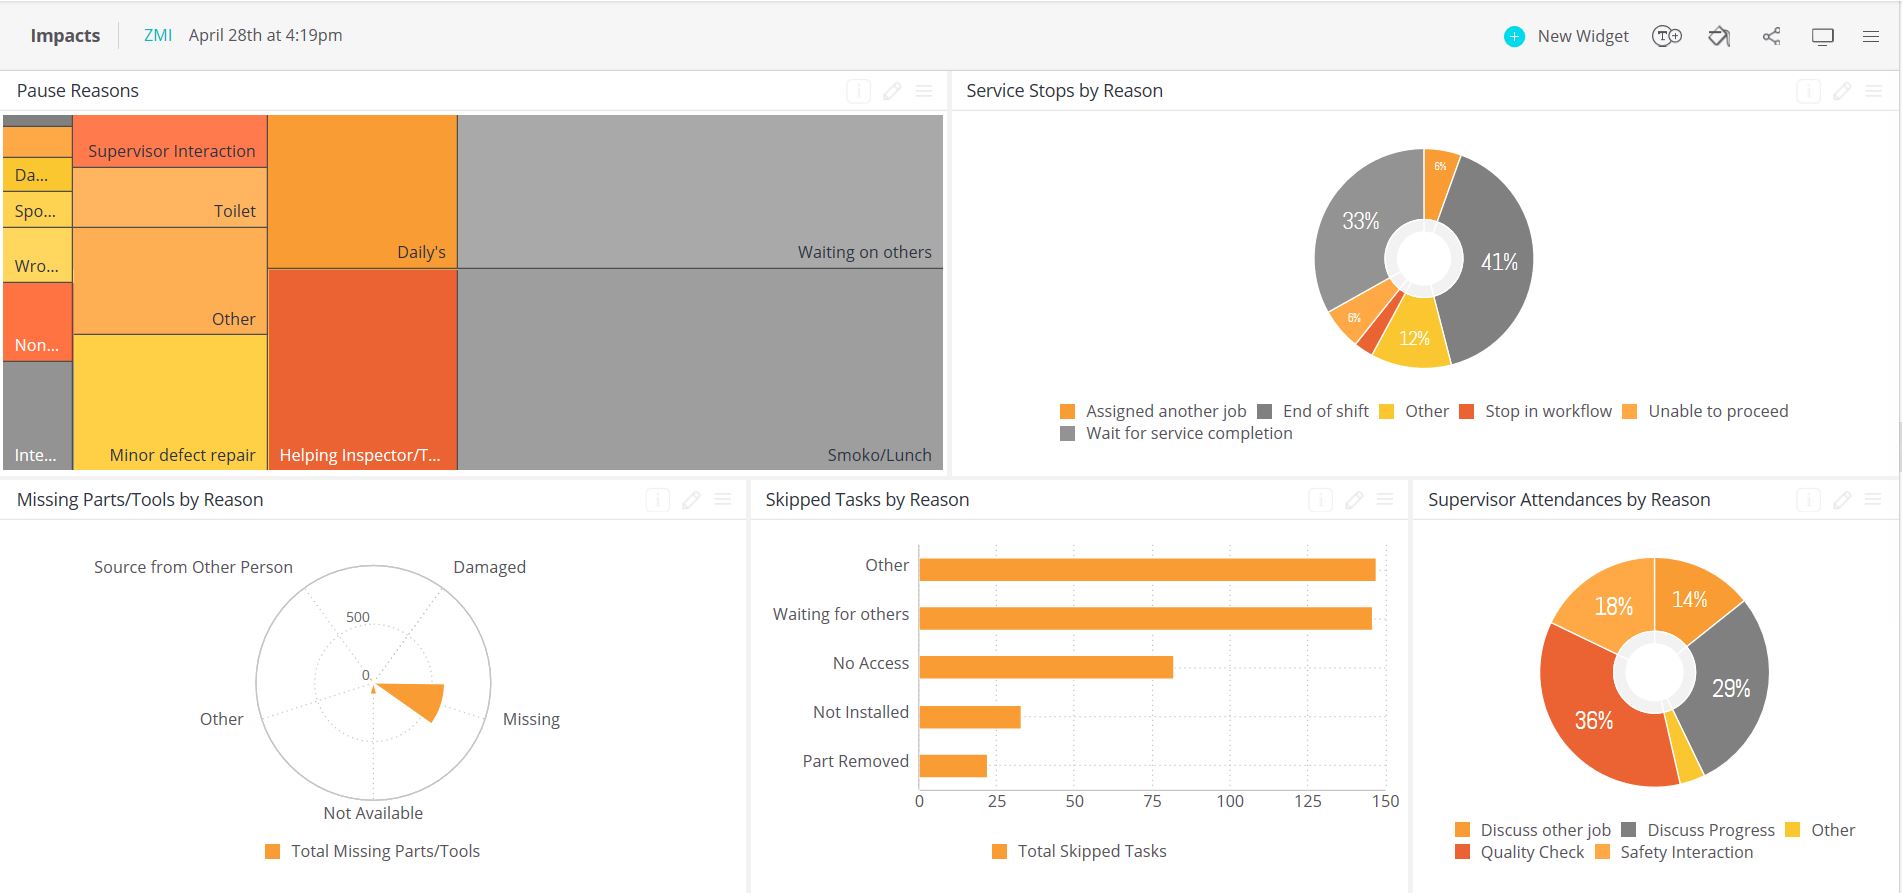
Advanced technological tools and features integrated within the ZoneMaintenance system enables and enhanced efficiency. These tools provided near real-time data on equipment status, maintenance schedules, and performance metrics, facilitating informed decision-making and proactive maintenance.
Achieving Accountability and Reliability
The core premise of ZoneMaintenance is that transparency drives accountability, which in turn increases asset reliability. Let's explore how this premise played out in our client's case.
Transparency and Accountability
With the implementation of ZoneMaintenance, transparency became the norm. Every team member had access to near real-time data on maintenance activities and equipment status and condition. This transparency fostered a sense of accountability as team members could see the direct impact of their actions on overall performance.
The Superintendent of the PM Bay highlighted this transformation, stating, "The culture changed to 'this is how we do maintenance now. While the move from paper to digital data collection and management was a positive and much needed change, the process still needs to be driven by our team discipline and accepting ownership for us to maintain sustainable success. "
Increased Asset Reliability
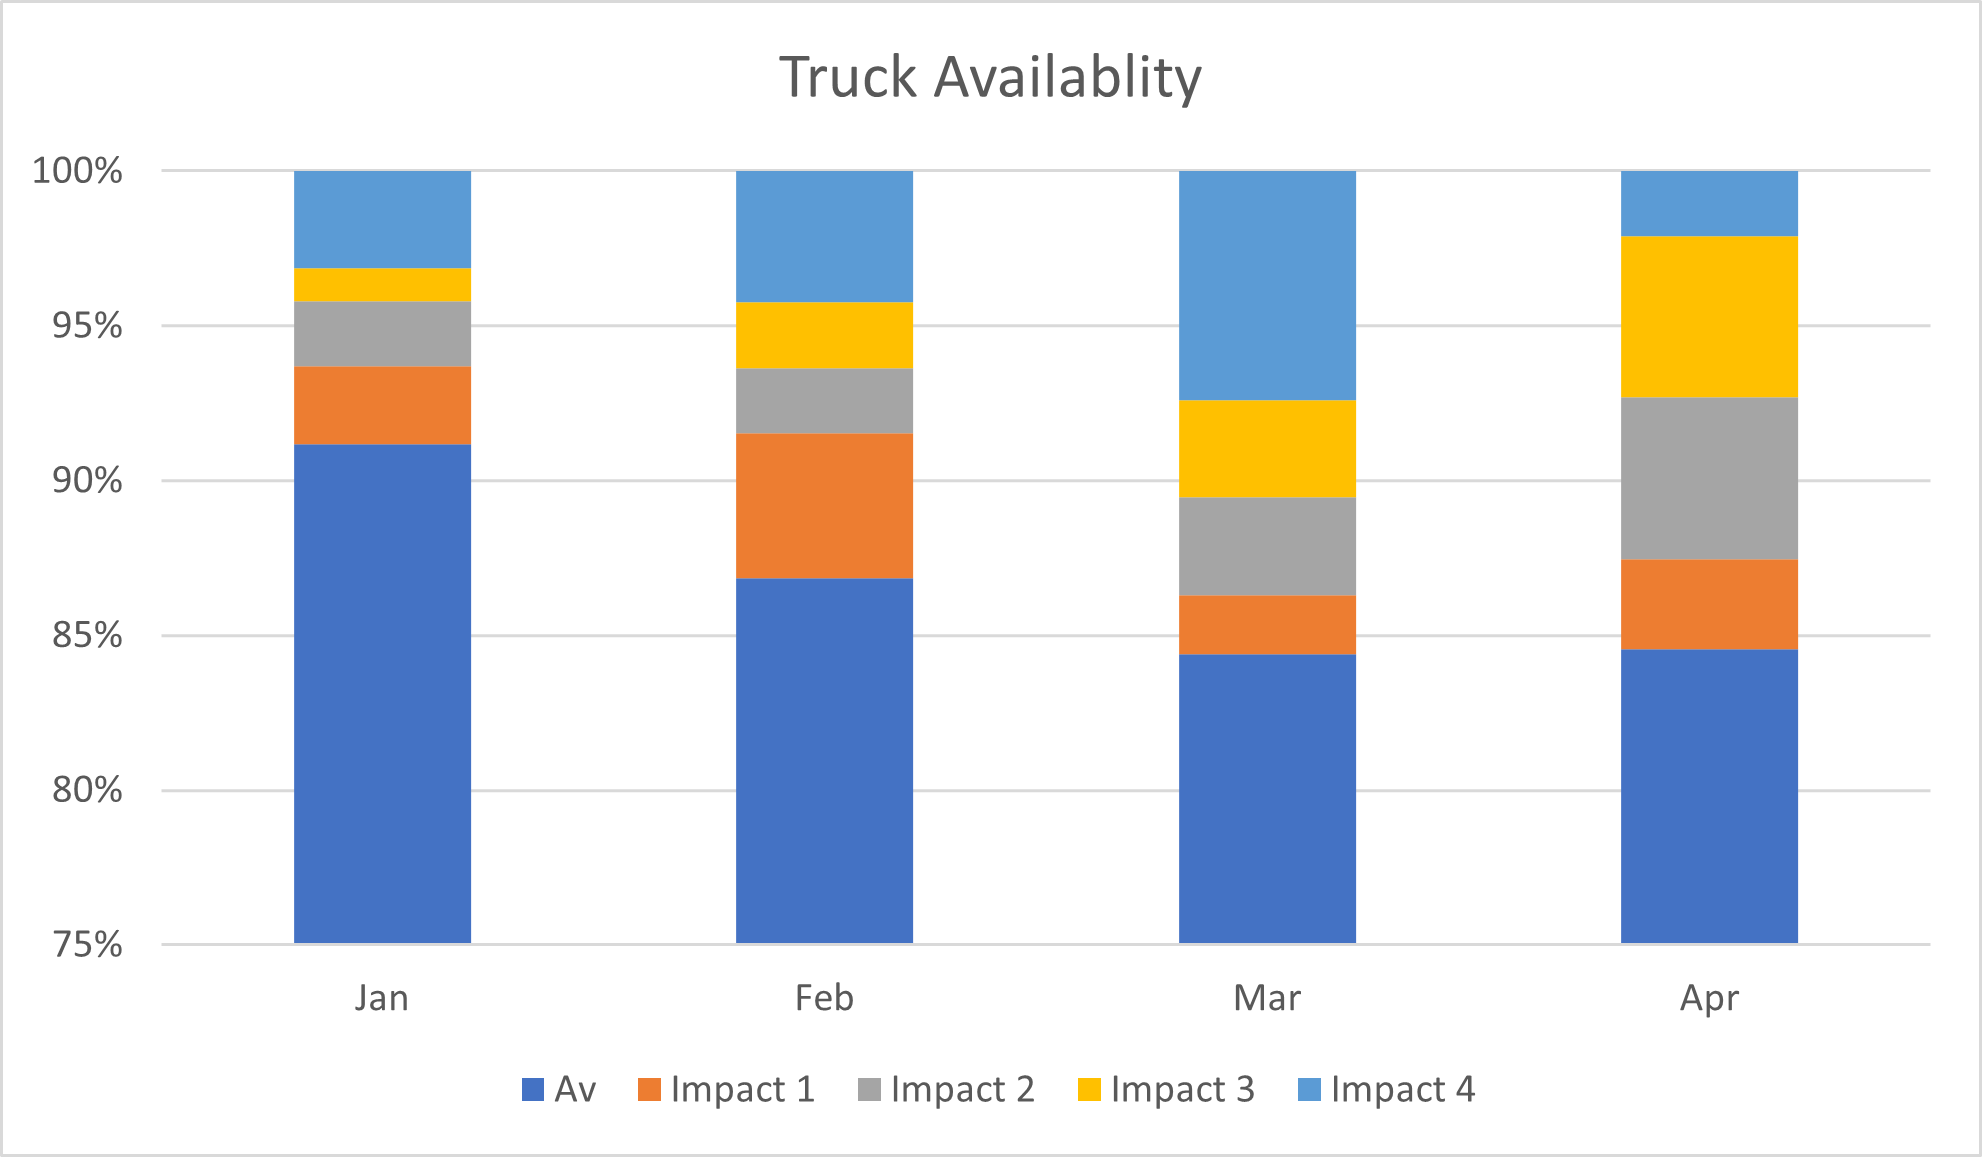
The increased accountability, in conjunction with in-house KPI monitoring and optimisation strategies combined, directly translated to improved asset reliability. Maintenance tasks were executed more efficiently and effectively, reducing downtime and extending the performance of equipment. The standardization of maintenance practices, enhanced data review and management capability and improved processes ensured consistency along with more effective decision making, further enhancing asset reliability.
Cultural Transformation
One of the most significant impacts of ZoneMaintenance was the cultural shift within the team. The transparency and accountability fostered a sense of pride and ownership among team members. They were no longer just performing tasks; they were contributing to the success of the entire operation. There was a new standard, and this is the standard we need to follow.
Continuous Improvement
ZoneMaintenance also instilled a culture of continuous improvement. Regular reviews and feedback requests via the software were conducted to identify areas for further enhancement of the process and of the content. This proactive approach ensured that the maintenance processes remained dynamic and adaptable to changing needs.
Additional Value Brought to the Team
Building on the success of ZoneMaintenance, additional value was brought to the team through several initiatives:
Enhanced Communication
The implementation of standardized communication protocols ensured that all team members were on the same page. Regular meetings around planning and fleet performance and updates facilitated seamless information flow and coordination also increased accountability between sections within the maintenance department.
Empowerment and Engagement
Team members were empowered to take ownership of their assets and make decisions from the data collected and presented within their areas of responsibility. This empowerment boosted their confidence and engagement, leading to higher productivity and job satisfaction.
Learning and Development
Ongoing training and development opportunities were provided to enhance the skills and knowledge of the team. This investment in their growth not only improved their performance but also demonstrated the company's commitment to their professional development.
For more insights into the additional value brought to the team, you can review a previous blog on Accountability Improves Reliability.
OEM Technical Support Feedback
An additional perspective on the impact of ZoneMaintenance came from the OEM Technical Support Personnel. They observed that the team gained control of the fleet quickly, resulting in a noticeable improvement in fleet performance. This swift control was attributed to the structured approach of ZoneMaintenance, which allowed for a more organized and effective management of the equipment.
The OEM Technical Support Personnel noted, "We saw the team gain control of the fleet quickly. There was a distinct shift in fleet performance because they gained this control and there was a clear improvement after ZoneMaintenance was introduced."
Higher Level of PM Servicing
With the newfound control and cultural change within the maintenance operation, the team was able to initiate a higher level of PM (Preventive Maintenance) servicing. They began a trial to perform 80-90% of the pre-service inspection tasks during the truck refuelling process. This innovative approach eliminated further downtime by utilizing the opportune time during refuelling.
ZoneMaintenance gave them the confidence, support and the system to manage this work over a 6-day period during each refuelling cycle. This proactive strategy not only minimized downtime but also ensured that the equipment was in optimal condition at all times.
Results Achieved
The results achieved within just six months of implementing ZoneMaintenance were nothing short of remarkable:
1. Significant Reduction in Downtime
The enhanced efficiency and effectiveness of maintenance activities led to a significant reduction in equipment downtime. This increase in uptime translated to higher productivity and profitability. An appreciation from Production/Operations was also shared to the Maintenance team.
2. Improved Equipment Performance
The standardized and proactive maintenance practices improved the overall performance, defect identification and reliability of the equipment. This improvement not only extended the performance of the assets but also reduced maintenance costs.
3. Enhanced Team Morale and Engagement
The cultural transformation brought about by ZoneMaintenance significantly boosted team morale and engagement. The sense of ownership and pride among team members led to higher job satisfaction.
4. Sustainable Improvement
The continuous improvement culture ensured that the gains achieved were sustainable. Regular reviews and feedback sessions allowed for ongoing refinement and adaptation of the maintenance processes.
Conclusion
The case of our mining client's mobile equipment asset management department serves as a powerful example of the transformative impact of ZoneMaintenance. By fostering transparency and accountability, the team not only achieved remarkable improvements in asset reliability but also experienced a cultural shift that elevated their performance and engagement.
ZoneMaintenance proved to be more than just a maintenance strategy; it became a catalyst for positive change, driving continuous improvement and long-term success. As the Superintendent of the PM Bay aptly put it, "Everyone was making a difference because of what ZoneMaintenance applied to the business." This case study underscores the profound benefits of embracing transparency and accountability in driving operational excellence and achieving outstanding results.
The feedback from OEM Technical Support Personnel further highlights the rapid control and performance improvements achieved through ZoneMaintenance. This endorsement reinforces the value of structured and transparent maintenance practices in transforming fleet management.
Furthermore, the ability to initiate a higher level of PM servicing during truck refuelling showcases the innovative potential unlocked by ZoneMaintenance. By performing 80-90% of pre-service inspection tasks during this opportune time, the team was able to eliminate further downtime, ensuring optimal equipment performance and reliability.
This detailed exploration of the transformation achieved by our client's mobile equipment department highlights the tangible benefits of implementing ZoneMaintenance. By emphasizing the crucial role of transparency and accountability, this case study serves as a testament to the power of structured and innovative maintenance practices in driving operational success.
What value do you place on a change to the culture within your department when accountability is achieved through a repeatable transparent system?
For more information about ZoneMaintenance and how it can transform your maintenance processes, visit Equipment Management's ZoneMaintenance.
Author: R.Harland Managing Director Equipment Management International P/L