![IMG_4188[1].JPG](https://images.squarespace-cdn.com/content/v1/57bd1b23d1758e6b2bb51a5f/1472532981835-CPZ48J79L44Z2AG6L6E0/IMG_4188%5B1%5D.JPG)
Are we focusing on the wrong numbers?
For the last 30+ years that I have been involved within the mining industry in mobile equipment maintenance, we have always been focused on achieving 85+% equipment availability with an aging fleet.
Every month we’re measured on our performance based on achieving this availability figure and then explaining why we didn’t achieve it.
At one site, in the mid 90’s, we (shift supervisors) had a daily target of 85% for our truck fleet and if we weren’t going to achieve this, we had to define a strategy for the next shift to pick up the lost percentages. This caused a lot of pressure on the middle management team and many poor short-term decisions were applied to ensure we met our daily KPI. This was in the mid 90’s and today we still see maintenance teams looking to achieve the same targets for an aging fleet.
Generally, at the end of the month someone must explain why this wasn’t achieved and what’s going to be done to reduce this from occurring again. With this comes a whole lot of searching into the downtime figures to see which asset or assets was the worst offender and what possibly happened that caused the effect. In most cases it seems to point to a series of downtime events that can be recorded into the monthly report and this is generally accepted as the cause, but it doesn’t consider the all the factors causing extended downtime events.
The work environment has changed, the equipment has improved (in most cases) with more advanced technology on board and off board systems have been introduced but still the same target has been accepted as monthly KPI. Why?

What if we looked at it from another perspective? What if we, as maintainers, forget about what the machine has achieved and focus on the percentage of time that wasn’t achieved and aim to understand this side of the equation.
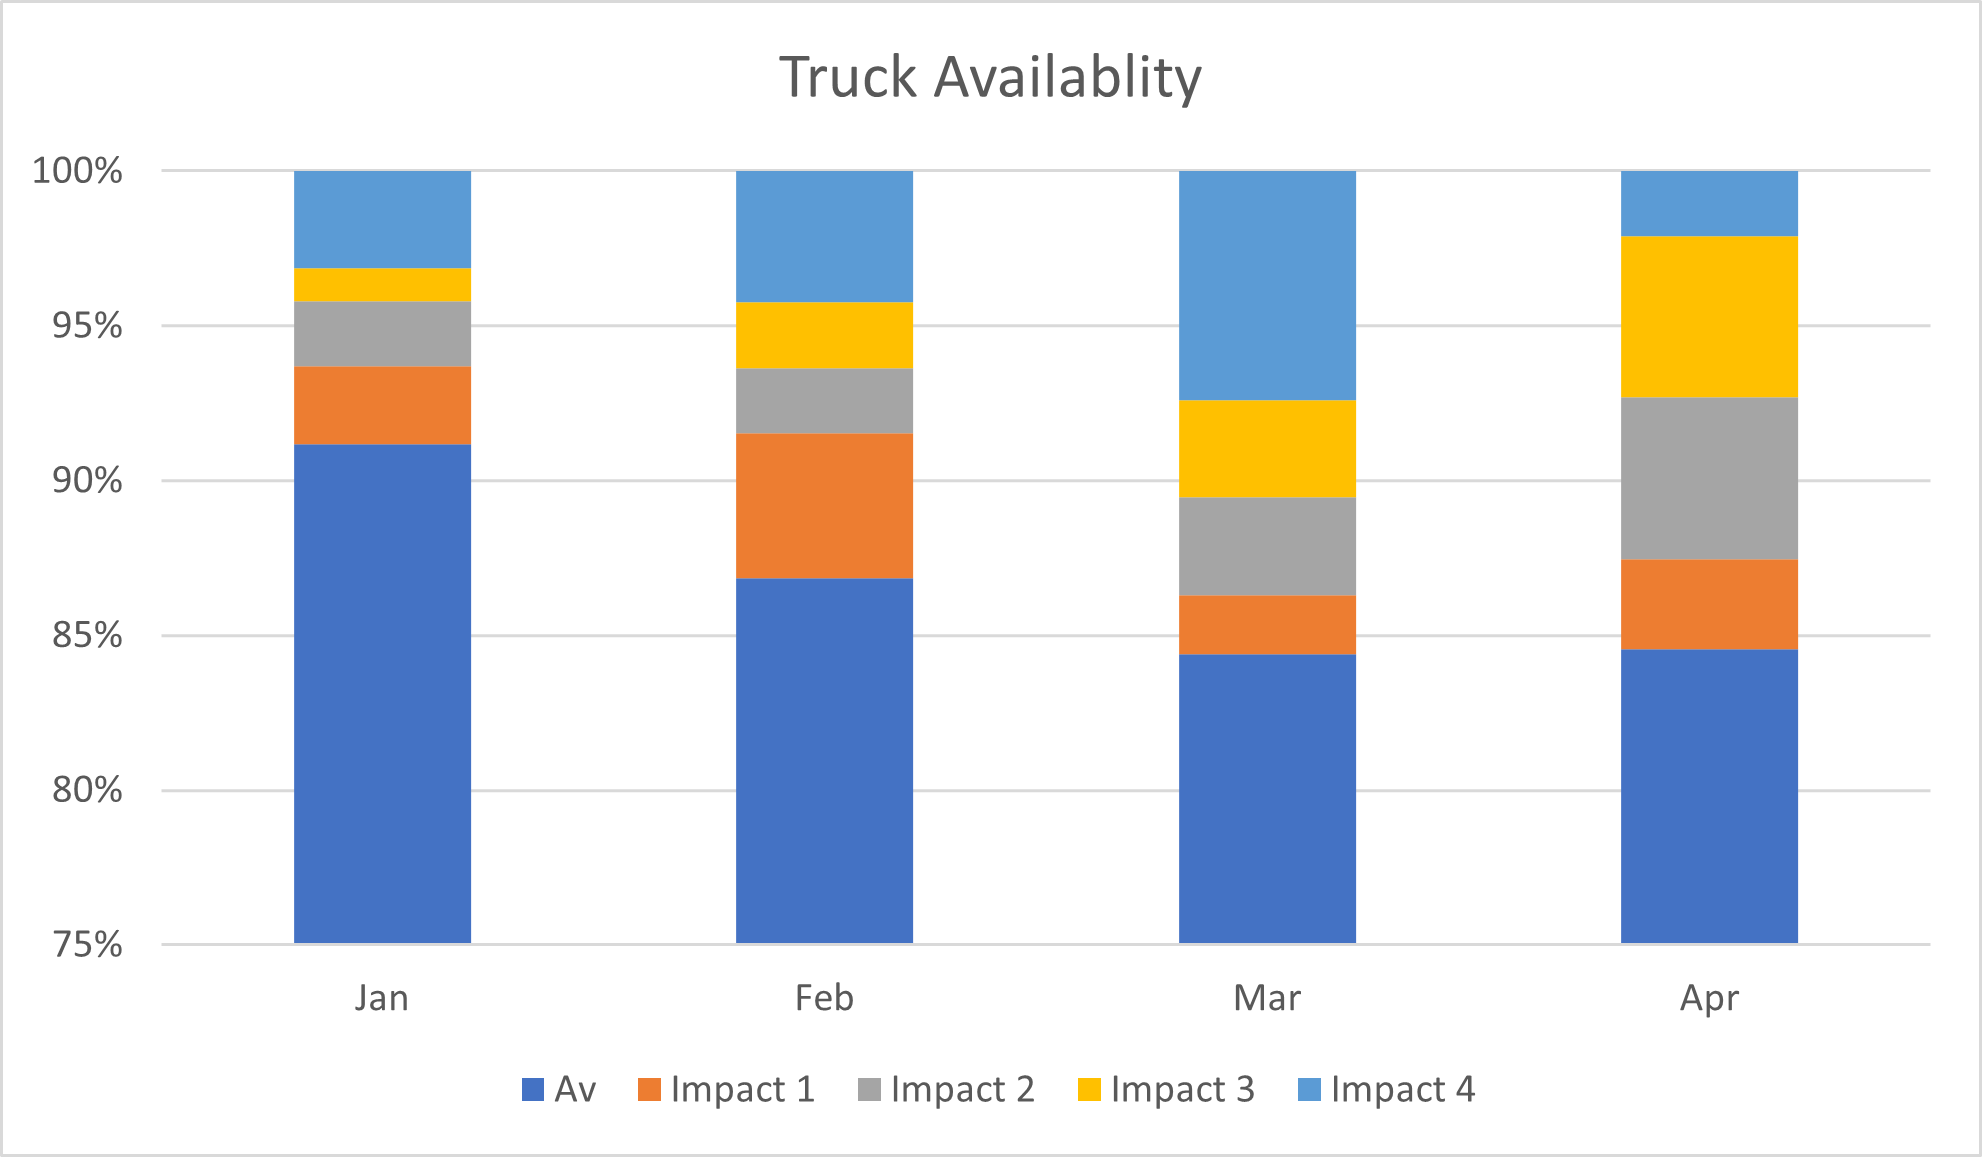
We need to define what these potential impacts are and then measure this in greater detail so that you can identify a trend/pattern and then drill into the actual reasons.
Examples of impacts to the targeted KPI
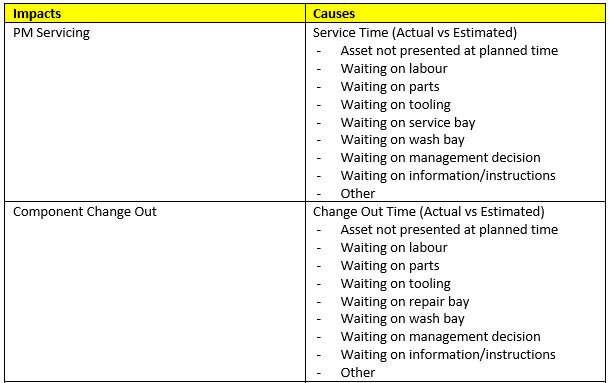
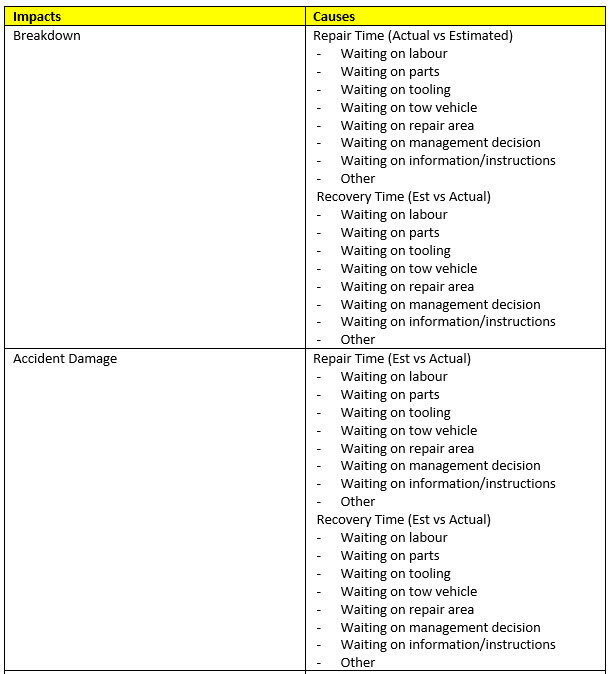

These are all potential causes to the lost available time of the fleet over the month and year. What is the impact to your operation and could there been a reoccurring event that could be addressed with a simple or sustainable solution?
Yes, understand that collecting this type of data is problematic now for most operations. That’s because the focus has been on the wrong data collection detail when trying to determine the productivity of the asset and the systems have been designed to capture available times. The tools, the systems and the data collection methods just need to adapt to capturing these matrixes as well.
If systems are put in place to capture this data of actual reason for lost time and captured electronically, the business then could identify the causes which can be used to justify more capital, more resources or better communication of work instructions.
I’m not saying that we stop measuring availability, it has its place. I’m suggesting that we need to consider the other impacts that are causing the lost production opportunities and that a general target of 85% is too low for an aging asset and we should be addressing what’s lost not what’s achieved and become more efficient and effective in these areas. The availability KPI will be achieved and most importantly exceeded.
Until the paradigm changes and the focus are towards what the true impact causes were then we’ll always achieve the same results.
copyright 2021 - Equipment Management International P/L